Commercial building · OR
Commercial Steel Buildings in Oregon
NOAA's narrative on the Climate of Oregon puts it plainly: the Cascade Range splits the state into a wet, mild western half and a drier, more extreme eastern half, and that single mountain line does more to shape a commercial building's siting than any statewide rule of thumb could. Layer in a farm sector that shrank to 35,547 farms in 2022 — down 6% since 2017, but still covering over 15.3 million acres at an average of 430 acres each — and the picture for a commercial buyer is a state where the region a parcel sits in, not a generic 'Oregon' profile, drives the drainage, foundation, and hazard-review conversation.
Climate Geography
One State, Two Climate Stories
The Cascade Range is the single most important line on the map for a commercial building's envelope and drainage plan in Oregon.
NOAA's National Centers for Environmental Information publish a narrative Climate of Oregon that describes the Pacific Ocean's dominant influence on the state overall, but the more useful working fact for a builder is what happens once you cross the Cascades: the western third of the state stays wet and mild, while the terrain east of the mountains turns drier and more temperature-variable. That is not a small stylistic difference — it changes what a commercial building's roof pitch, gutter capacity, and wall assembly need to handle.
The National Weather Service's Portland office publishes a 1991-2020 water-year normal of 36.91 inches of total precipitation for the Portland area, a genuinely wet figure by national standards. But that number describes the Willamette Valley corridor, not the state as a whole, and a commercial buyer siting a building near Bend, Pendleton, or anywhere east of the Cascades should not plan drainage or roof-load assumptions around a Portland-area normal.
Portland's own temperature normals — a 47.5°F average January high climbing to about 82.3°F in August — also show a moderate, marine-influenced pattern that eastern Oregon's more continental climate does not share. The practical takeaway: request the closest official weather-station normal to the actual build site before finalizing envelope specifications, rather than defaulting to whichever Oregon climate figure is easiest to find.
Economic Backdrop
Fewer, Larger Farms Behind Commercial Storage Demand
Oregon's agricultural land base is consolidating into fewer, larger operations, a trend that shapes the scale of commercial storage and processing buildings being planned.
USDA's 2022 Census of Agriculture counted 35,547 farms in Oregon, a 6% decline from the 2017 count. At the same time, the state still had 15,295,779 acres in farms, working out to an average farm size of 430 acres. Fewer, larger operations often mean each remaining farm has more land and more product to store, sort, or process, which supports demand for larger commercial-scale buildings rather than a proliferation of small ones.
For a commercial buyer serving this base — grain handling, produce packing, cold storage, or equipment service — the sizing conversation should start from the specific operation's scale rather than a generic small-business footprint. A processing building serving a 430-acre-average operation has different bay-depth and door-height needs than a small-town retail storefront, and treating the two as the same brief risks an undersized building.
- Scale to the Operation, Not the Town
- A larger average farm size can mean a larger building brief even in a town with a small population.
- Check the Region's Crop Mix
- Willamette Valley nursery and berry operations have different storage needs than eastern Oregon grain or cattle operations.
Site Selection
Where Hazard Data Actually Lives for an Oregon Site
Oregon hazard exposure is documented county by county through two separate agencies, not as a single statewide figure.
FEMA National Risk Index
FEMA's NRI report viewer publishes county-level reports — such as the one available for Linn County — covering 18 hazard types across all 36 Oregon counties. Pull the report for your exact county before assuming a risk level.
DOGAMI SLIDO (Landslide Mapping)
The Oregon Department of Geology and Mineral Industries maintains the Statewide Landslide Information Database, a state-specific geologic-hazard layer worth checking alongside FEMA data, especially on sloped or hillside commercial parcels.
DOGAMI Seismic Soil Mapping (Willamette Valley Counties)
DOGAMI has published coseismic landslide susceptibility, liquefaction susceptibility, and soil amplification maps for Clackamas, Columbia, Multnomah, and Washington counties, intended for use with FEMA's HAZUS loss-estimation methodology — a resource worth requesting if your site falls in one of these counties.
Get Oregon Commercial Building Quotes
Tell us which side of the Cascades your site sits on and your intended use, and we'll route the right climate and hazard questions with your Oregon context attached.
Configuration
How Oregon Commercial Buildings Get Used
Oregon's split geography and consolidating farm base shape the commercial building briefs most worth planning around.
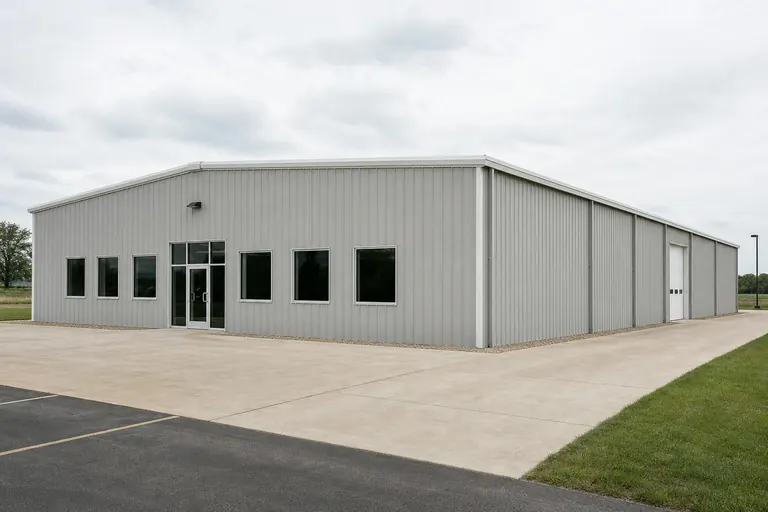 Ag Processing and StorageSized to a specific operation's scale given Oregon's 430-acre average farm size, with drainage and roof design matched to the side of the Cascades the site sits on.Light Industrial / DistributionClear-span working bays with loading access, common along Interstate 5 corridor sites and eastern Oregon freight routes alike.Retail or Service FrontA finished front section attached to a working bay, sited with local snow, rain, or wind exposure confirmed against the nearest weather-station normal.
Example Configuration — for planning purposes only.
Footprint
Sizes That Suit Common Oregon Commercial Briefs
A reasonable starting range before a site-specific plan is drawn.
40′ × 60′
2,400 sq ft
A single working bay with a small office or retail front.
60′ × 100′
6,000 sq ft
Room for ag storage or a multi-bay light-industrial layout.
80′ × 150′
12,000 sq ft
Larger processing or distribution footprints scaled to a consolidated farm operation.
Example Configuration — for planning purposes only.
Confirm code, permit, and snow/rain load specifics with your local building department; Cascade-divide climate differences mean a design that works in the Willamette Valley may not transfer to eastern Oregon.
Questions
Oregon Commercial Steel Building Questions
Questions answered honestly at the state level, with the rest routed to the party that owns them.
No. NOAA's Climate of Oregon narrative describes the Cascade Range as dividing a wet, mild western Oregon from a drier eastern Oregon. Use the closest official weather-station normal to your actual site, not a single statewide figure.
No. The 36.91-inch water-year normal is specific to the Portland area per NWS records. Sites east of the Cascades or along the coast see different totals; confirm with the nearest station or your engineer.
USDA NASS recorded 35,547 Oregon farms in 2022, down 6% since 2017, averaging 430 acres each. That consolidation trend supports demand for larger storage and processing buildings serving fewer, bigger operations.
Use FEMA's National Risk Index report viewer for your county, and check DOGAMI's SLIDO landslide database for slope-related risk. Neither source assigns a single statewide hazard score to Oregon.
For Clackamas, Columbia, Multnomah, and Washington counties specifically, DOGAMI has published coseismic landslide, liquefaction, and soil amplification mapping intended for FEMA's HAZUS methodology. Sites outside those counties should ask DOGAMI directly about available mapping.
There is no official typical size; use varies by industry and region. Many inquiries fall between 40x60 and 80x150 depending on whether the building serves ag processing, distribution, or a retail front.
Sources for the Oregon facts on this page
This page states no code requirement, wind speed, snow load, permit rule, price or supplier claim. The state-specific facts it does use are listed with their publisher below.
NOAA NCEI publishes a narrative 'Climate of Oregon' noting the Pacific Ocean's dominant influence on the state's mild, varied climate and the Cascade Range's role in dividing wet western Oregon from drier eastern Oregon.
NOAA National Centers for Environmental Information (NCEI) · Historical narrative (NCEI climate normals series) · Tier 1
https://www.ncei.noaa.gov/data/climate-normals-deprecated/access/clim60/states/Clim_OR_01.pdfNWS Portland's climate book reports Portland's 1991-2020 normal water-year (Oct 1-Sept 30) total precipitation at 36.91 inches.
National Weather Service (NOAA), Portland OR office · 1991-2020 normal (record from 1872-73) · Tier 1
https://www.weather.gov/media/pqr/climate/ClimateBookPortland/pg96.pdfOregon had 35,547 farms in 2022, down 6% since 2017.
USDA National Agricultural Statistics Service (NASS) · 2022 · Tier 1
https://www.nass.usda.gov/Publications/AgCensus/2022/Online_Resources/County_Profiles/Oregon/cp99041.pdfOregon had 15,295,779 acres of land in farms in 2022, an average farm size of 430 acres.
USDA NASS · 2022 · Tier 1
https://www.nass.usda.gov/Publications/AgCensus/2022/Online_Resources/County_Profiles/Oregon/cp99041.pdfFEMA's National Risk Index is the authoritative source for county- and state-level natural hazard exposure ratings across 18 hazard types, viewable via FEMA's own interactive report tool.
Federal Emergency Management Agency (FEMA) · Current NRI release · Tier 1
https://www.fema.gov/flood-maps/products-tools/national-risk-indexThe Oregon Department of Geology and Mineral Industries (DOGAMI) maintains the Statewide Landslide Information Database for Oregon (SLIDO), a state geologic-hazard mapping resource covering landslide susceptibility statewide.
Oregon Department of Geology and Mineral Industries (DOGAMI) · SLIDO-4.5 released April 12, 2024 · Tier 2
https://www.oregon.gov/dogami/slido/Pages/data.aspx